User-driven metrics help ensure you’re moving your usability needle in the right direction and building the right product for your customers. With a couple of simple tools you can get started right away.

Quantify Usability - Right Now
Article Oct 06, 2015
Lisa Douglas
When we begin a new project with a client we like to understand how their current system is working for them. There are a few ways of gathering this information. One method that has been used in the industry for a long time and provides a quantitative measure is the System Usability Scale (SUS). If your goal is to understand how usable a system is, this is a great place to start.
Another data gathering instrument is the Microsoft Desirability Toolkit Product Reaction Words. While not as quantitative as the SUS, this data helps us gain insight into users emotional response to a system.
Let’s have a look at both.
System Usability Scale
The SUS is used to evaluate new features and baseline systems. The SUS was developed by John Brooke in 1986 as a quick questionnaire allowing users to objectively evaluate products and services. It is a 10-item survey that uses a 5-point Likert scale (strongly agree to strongly disagree) to evaluate the overall usability of a system. In the software development field, and particularly in the User Experience world, the SUS is considered an industry standard and has been the focus of research and meta-analyses.
Here are the questions in the SUS:
- I think that I would like to use this system frequently.
- I found the system unnecessarily complex.
- I thought the system was easy to use.
- I think that I would need the support of a technical person to be able to use this system.
- I found the various functions in this system were well integrated.
- I thought there was too much inconsistency in this system.
- I would imagine that most people would learn to use this system very quickly.
- I found the system very cumbersome to use.
- I felt very confident using the system.
- I needed to learn a lot of things before I could get going with this system.
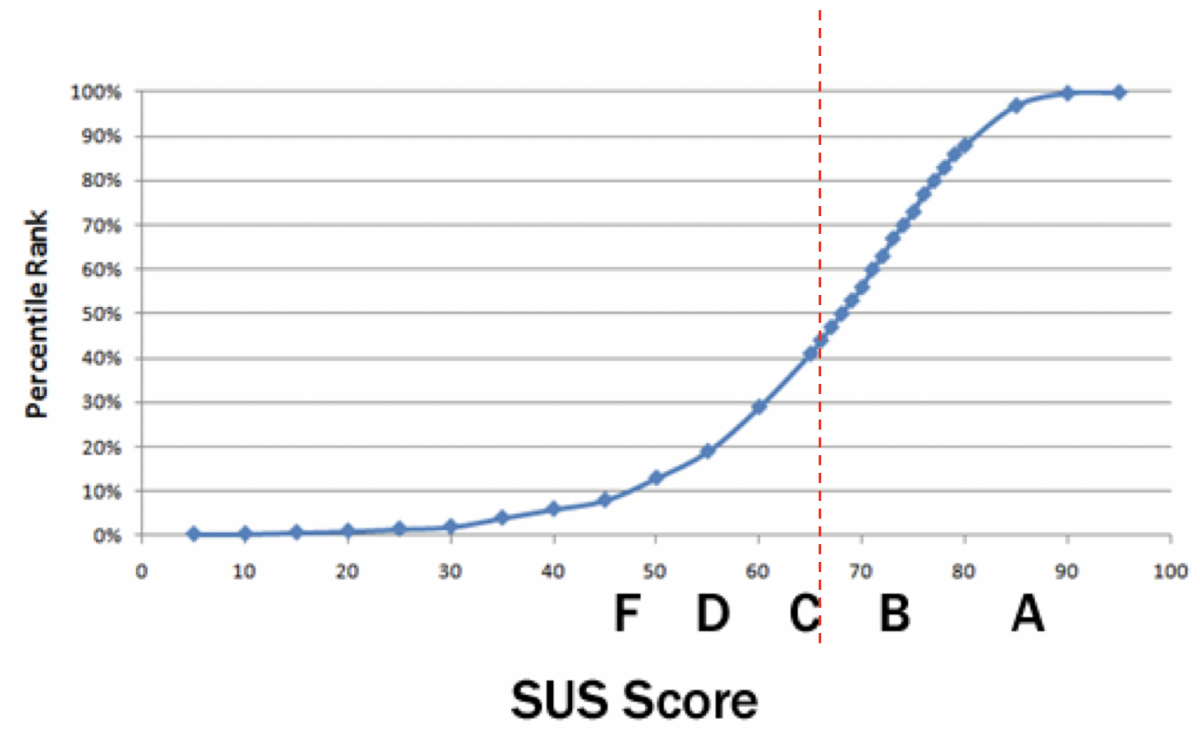
Once users have completed the SUS it is scored and transformed to a 100-point scale. Shown in the graph below, an average SUS scores is a 68. The results of the assessment have proven to be very robust and the SUS items are highly correlated, giving practitioners the option to use a subset of statements as required.
This fast, inexpensive usability test provides solid and dependable judgement on the usability of your system. However, sometimes we want to understand the emotional response to a system, and this is where the Microsoft Desirability Toolkit Product Reaction Words shines.
Microsoft Desirability Toolkit Product Reaction Words
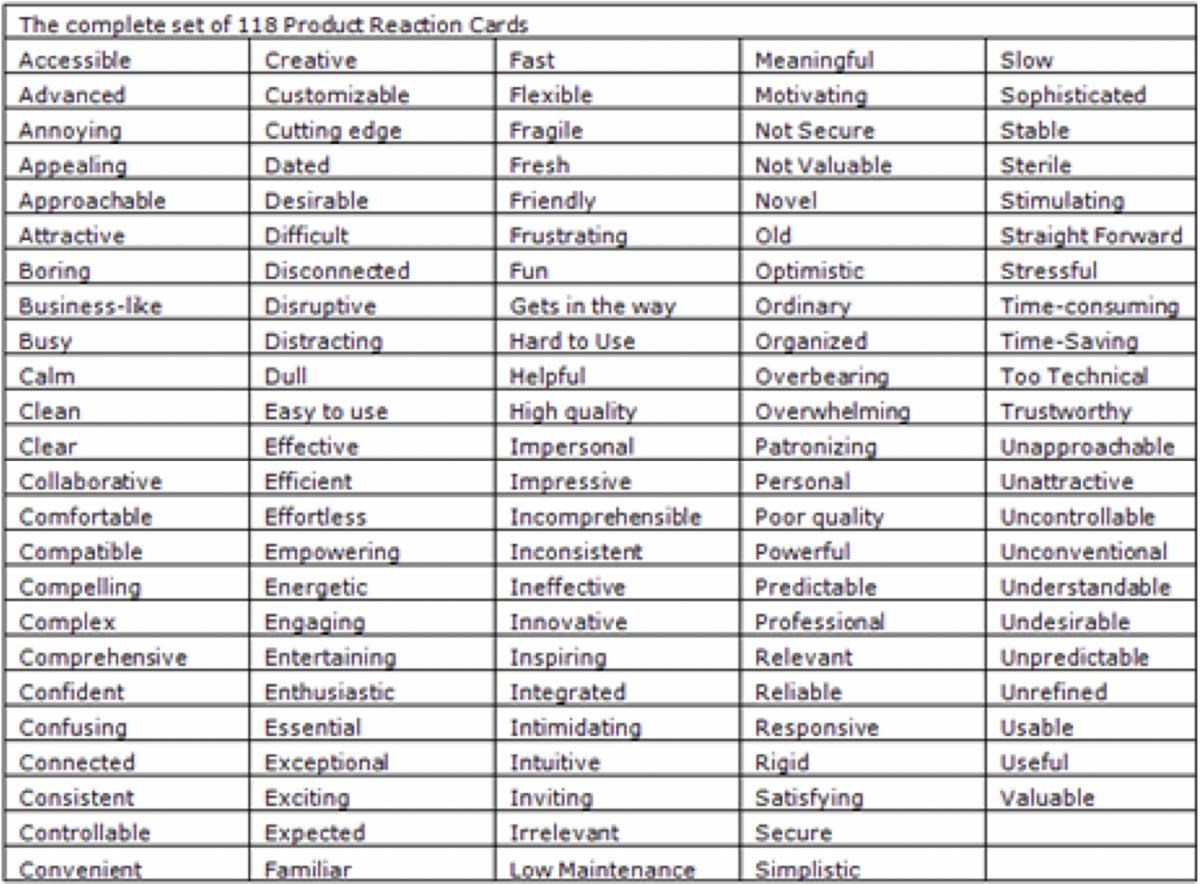
Developed in 2002 by Joey Benedeck and Trish Miner at Microsoft®, the Microsoft Desirability Toolkit Product Reaction Words, or Adjective Task (as we call it), is an opportunity for users to objectively express more emotionally-laden responses to a product or software. Whereas the SUS measures the usability, the Adjective Task allows researchers to understand how a user might feel about and describe a system by choosing words from a list of 118 different adjectives (see table below). It’s very powerful to share user-chosen words with stakeholders such as Fresh, Attractive, and Time-saving.
User-driven metrics help ensure you’re moving your usability needle in the right direction and building the right product for your customers. With the simple tools available, there is no reason not to begin to quantify your usability. Start now.
Looking for a guide on your journey?
Ready to explore how human-machine teaming can help to solve your complex problems? Let's talk. We're excited to hear your ideas and see where we can assist.
Let's Talk